Home Platform Industries Why Prediktis Company 12-month offer Contact

One platform for
the whole maintenance cycle.

From the first abnormal reading to the closed ticket and the cost of the spare part. Every module works on the same assets, sites and people, so nothing is typed twice.

01 · Condition monitoring

Read asset health.
Don’t guess it.

Vibration and temperature sensors on critical equipment send readings to Prediktis continuously. Each asset gets a clear status, Normal, Warning or Critical, based on the limits you set.
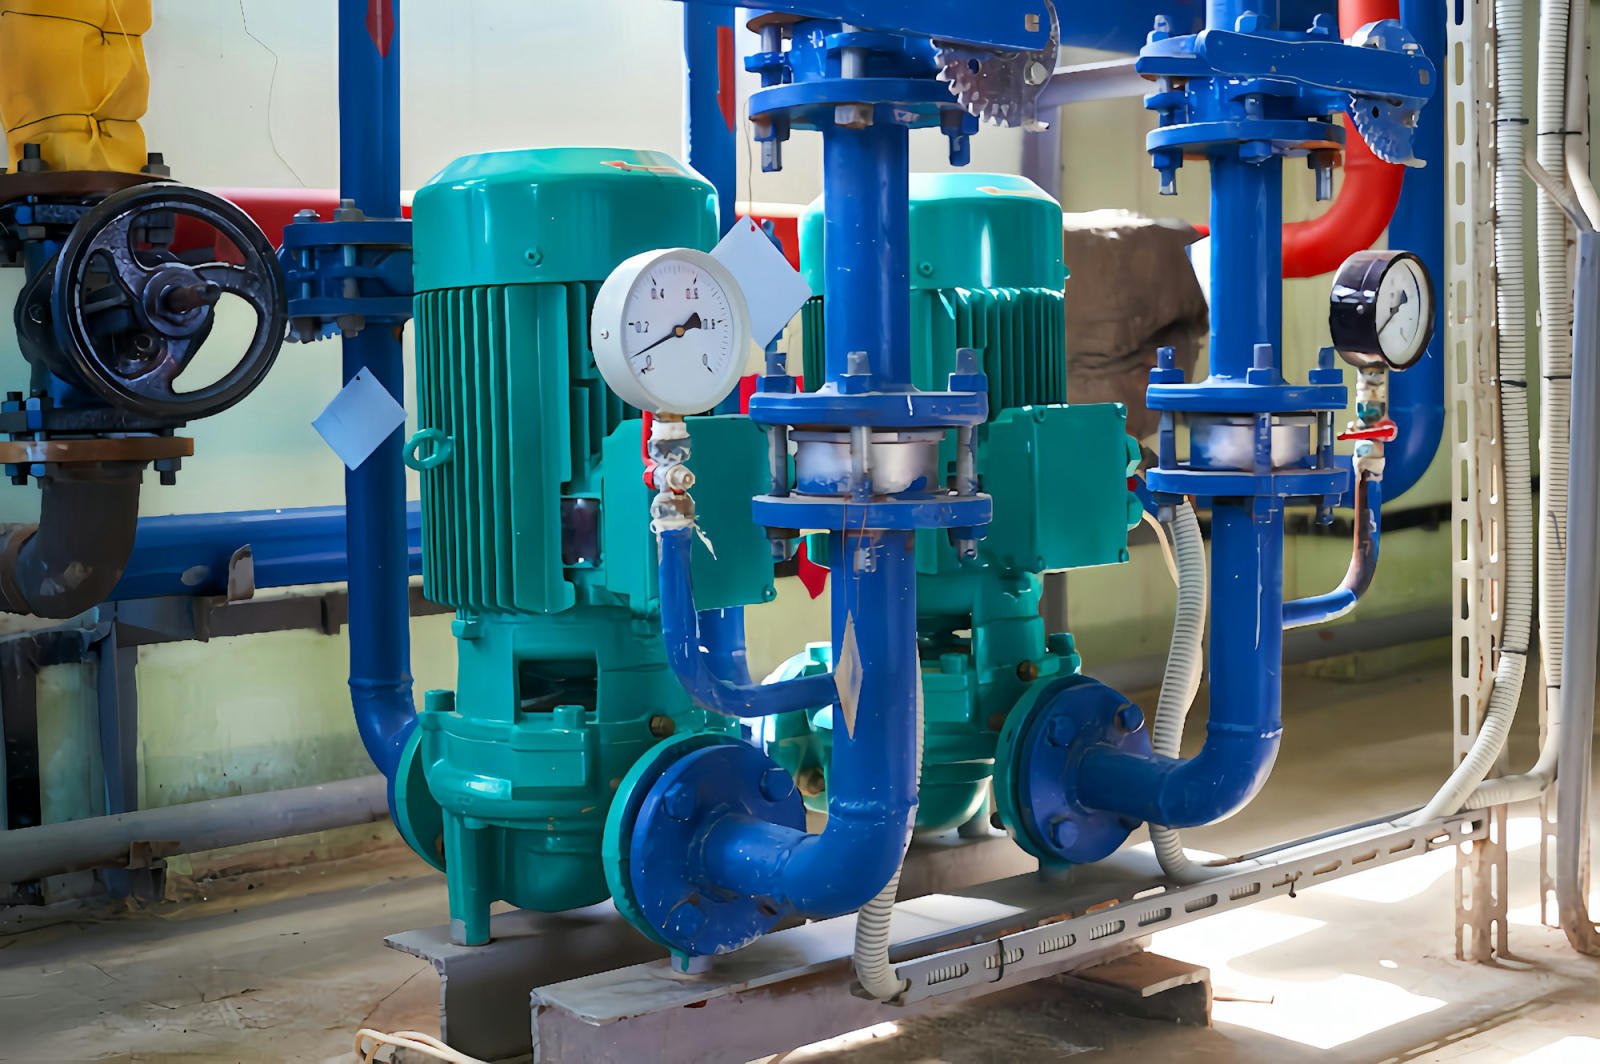
  • Overview of normal, warning and critical assets with the time of the last sync
  • One card per asset with the latest reading and active alert
  • Data visualization and sensor analysis to compare readings over time
  • Vibration analysis to spot imbalance, misalignment and wear early
More about predictive maintenance
Pumps with pressure gauges in a pumping station● Pump P-02 · 2.1 mm/s · Normal
02 · Alarms and notifications

The right alert,
in the right inbox.

Set a warning value and a damage value for every device and sensor, and choose who is notified for each device. Every alarm is stored with its reference values.

  • Two levels per sensor: warning and damage
  • Notification emails configured per device
  • Alarm history per asset, by day, week, month or year, exportable
Alarm thresholds Example configuration
DeviceStatusWarningDamagePeople
Feed pump · vibrationNormal2.84.54
Pump P-02 · bearingWarning4.57.13
Compressor · temperatureNormal75 °C90 °C2
Backup generator · vibrationNormal3.56.02
03 · Work orders and planning

A CMMS technicians
actually use.

Every intervention is a ticket linked to an asset: who reported it, the work type, priority, department, technician, planned hours and deadline.
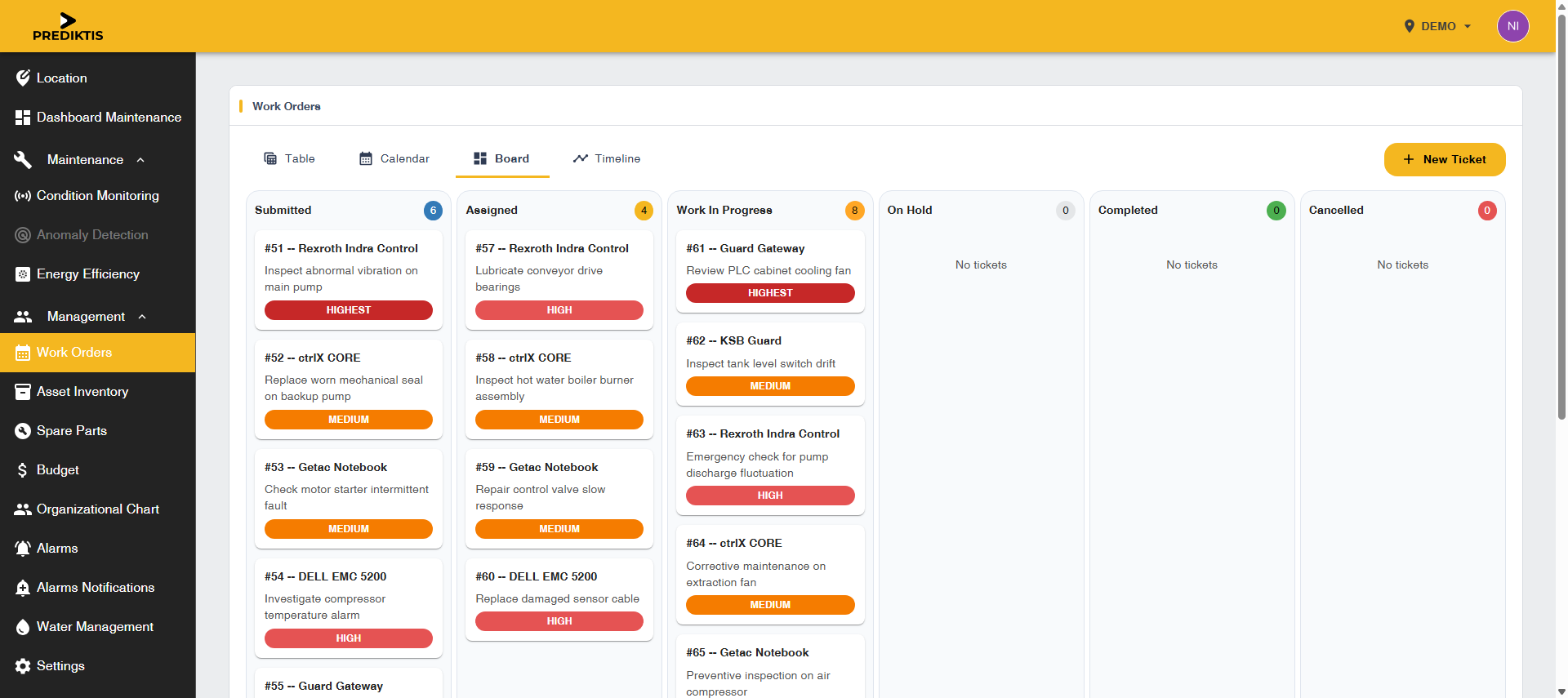
  • Preventive, corrective and inspection work
  • Table, calendar, board and timeline views of the same tickets
  • Photos attached and a full repair history per asset
  • Overdue plans and incomplete tickets on the dashboard
More about our CMMS
Work orders board in Prediktis
04 · Assets and spare parts

Know what you own
and what it needs.

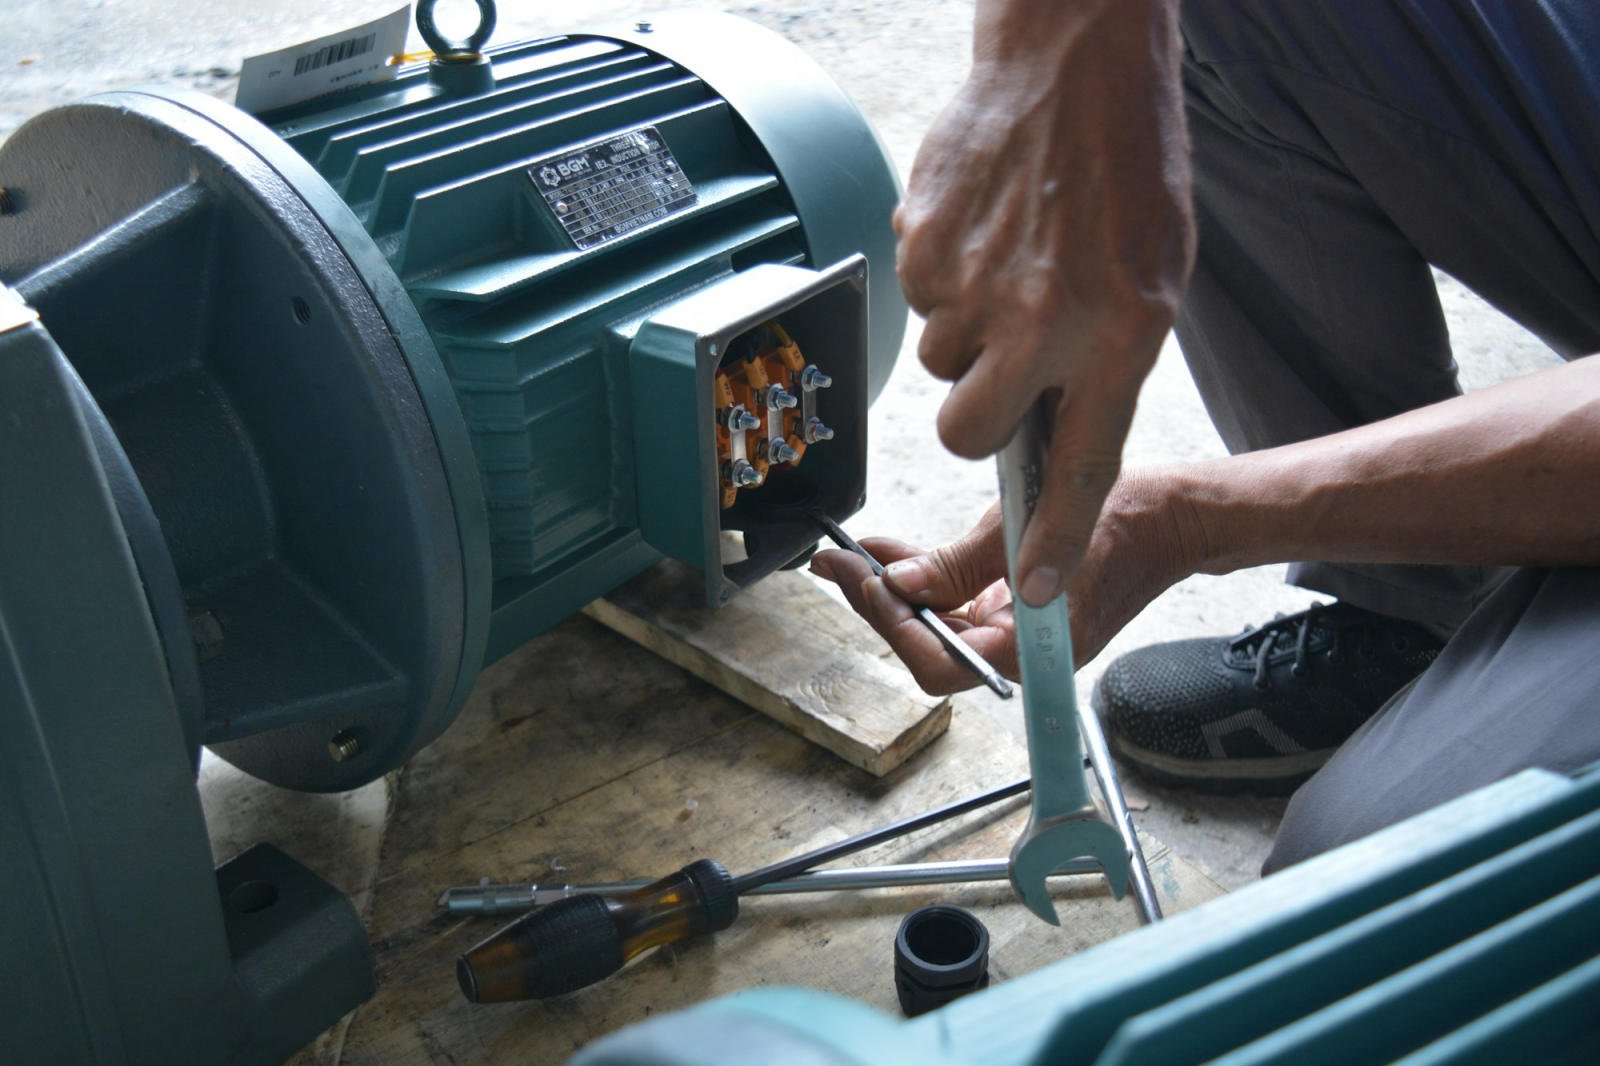
A register of equipment linked to the spare parts that keep it running. The part is on the shelf before the breakdown, not ordered after it.
  • Equipment by location, type, working hours and criticality
  • A QR code on every asset to open its record from the floor
  • Stock, bin, warehouse, minimum level and reorder quantity per part
  • Inventory value per part and per cost center
Technician working on an electric motor● Bearing kit SP-01 · 2 in stock · reorder 6
05 · Budget and costs

Spend under control
before month-end.

Plan the maintenance budget per cost center and see where it goes as work is logged: routine maintenance, emergency repairs and capital projects.
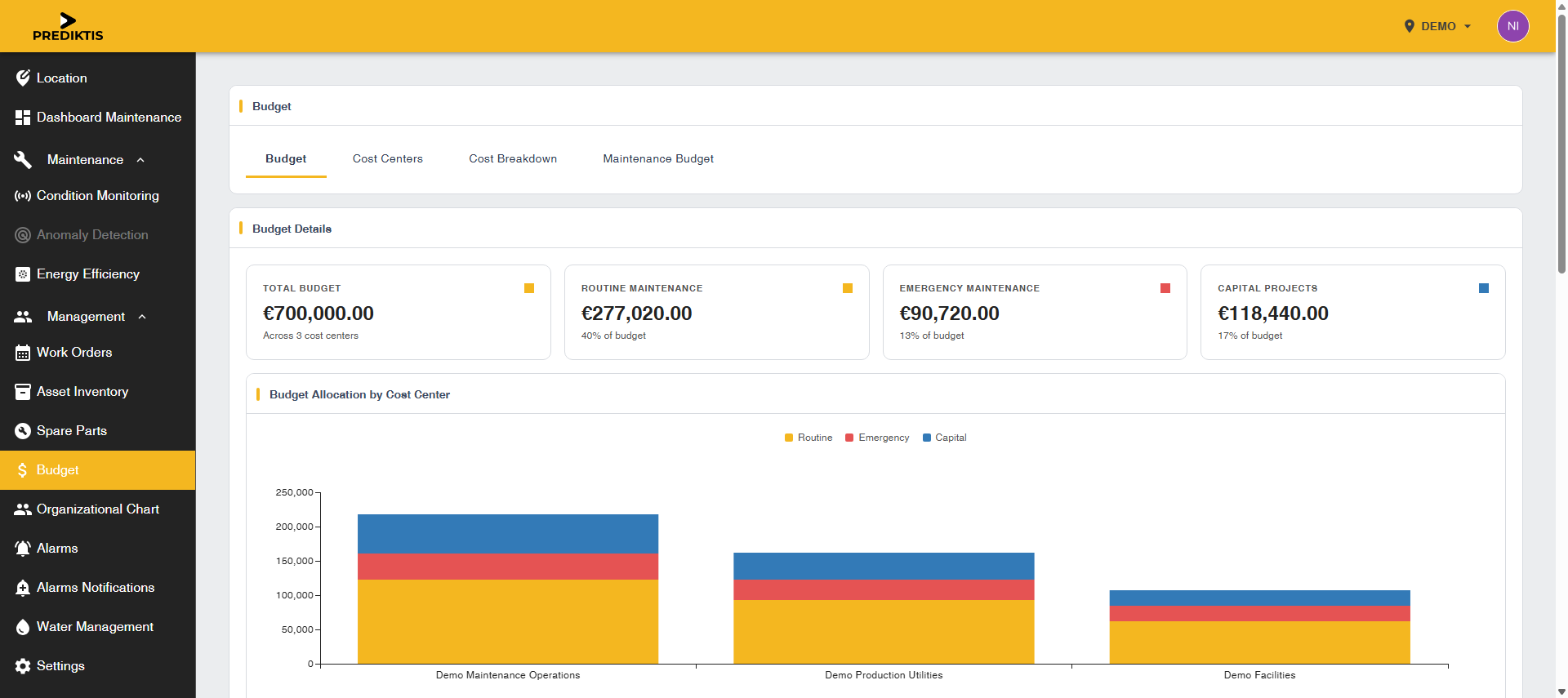
  • Cost centers with GL account codes
  • Budget, spent and remaining per cost center
  • Maintenance cost and downtime causes on the dashboard
Budget per cost center in Prediktis
06 · Energy efficiency

Every kilowatt-hour
tied to an asset.

Efficiency gauges per pump, motor or fan show efficiency, vibration and temperature together, so a mechanical problem and an energy problem are seen as one.
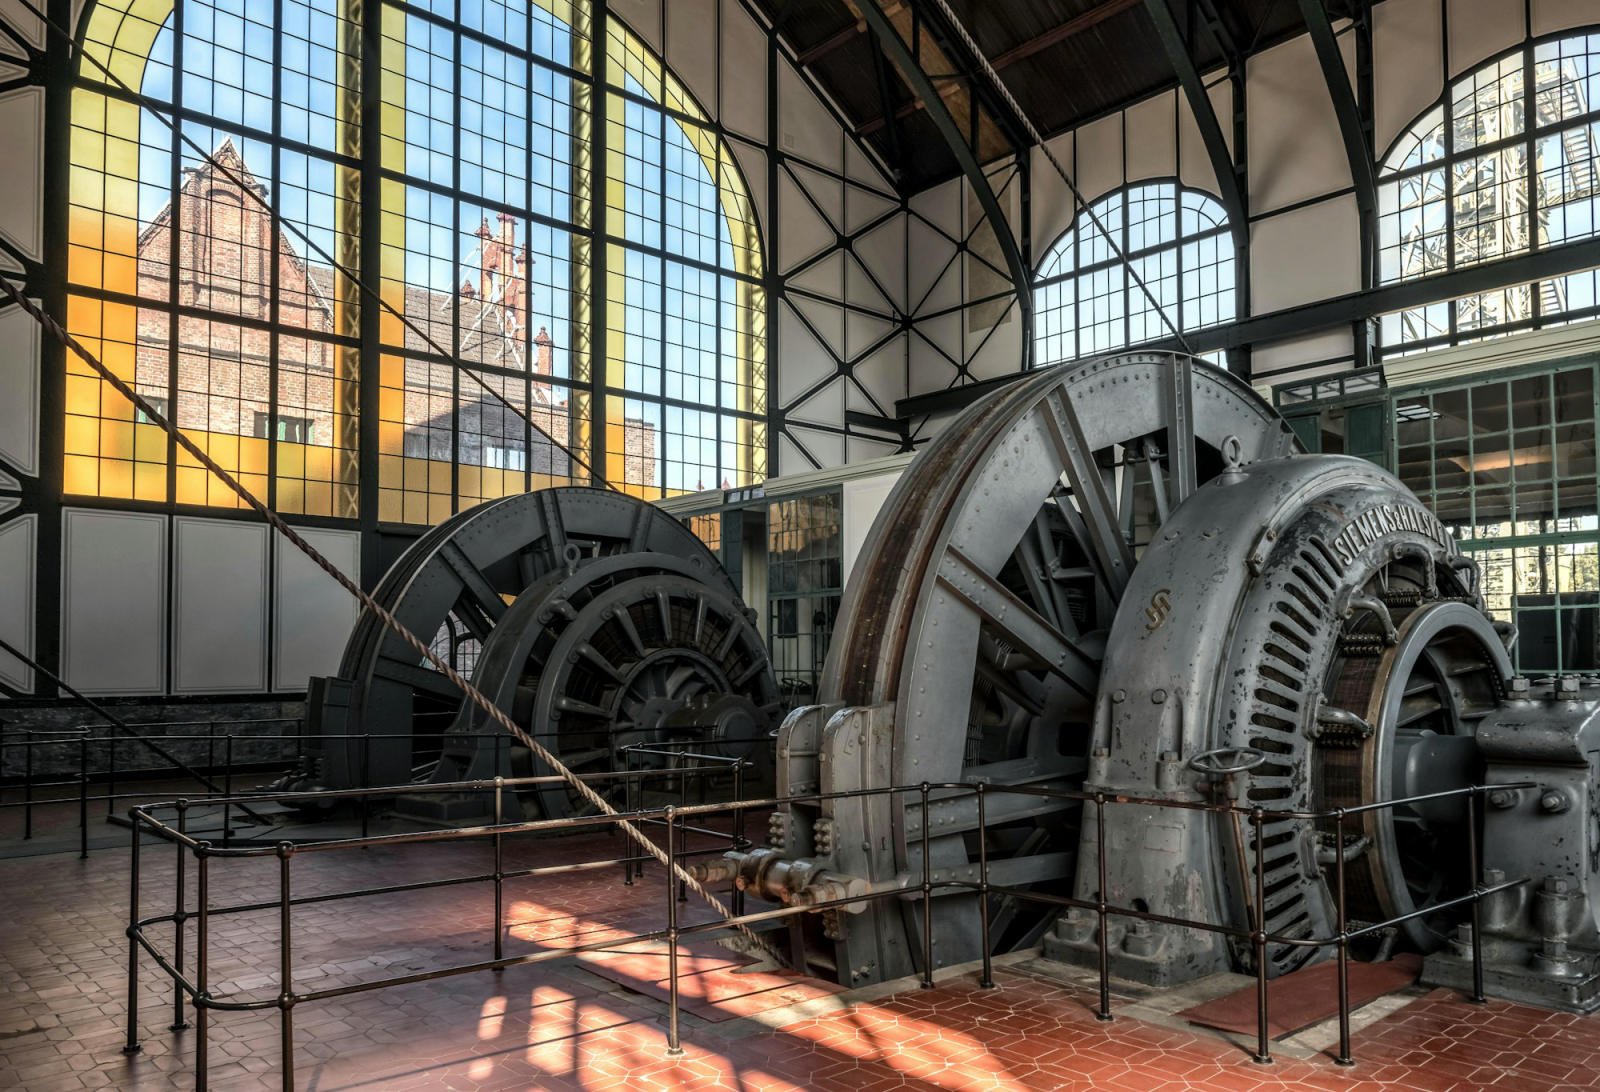
  • Efficiency overview per asset with an editable layout
  • Data table and energy analysis per asset
  • CO₂ calculated with your own emission factor
Generators in a turbine hall● Pump 18 · efficiency 80.6%
07 · Water management

Non-revenue water,
measured.

Built for water utilities: water balance entries, yearly loss targets, loss percentage, specific loss per kilometre of network and losses by system, in line with ANRSC reporting in Romania.
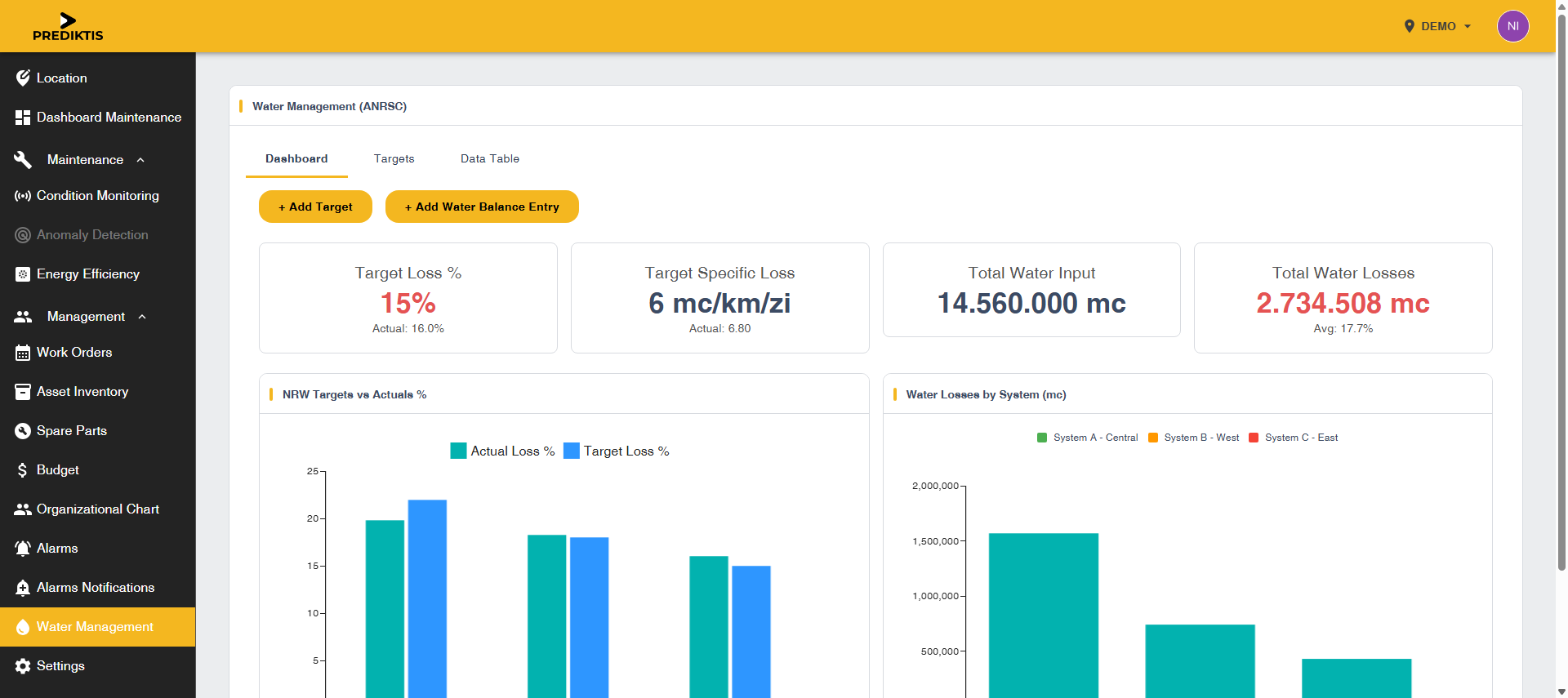
  • Target against actual loss, per year and per system
  • Total water input and total losses
  • Pumping station maintenance in the same platform
More about non-revenue water
Water management in Prediktis
08 · Anomaly detection · in development

Learning what normal
looks like.

Fixed limits catch the obvious. The module we are building learns each machine’s normal pattern from its own history and the faults your team confirms, and flags deviations a static limit would miss. INFOSEC CENTER SRL was selected for the BSC AI Factory Incubation Space Program in 2026 to support this work.
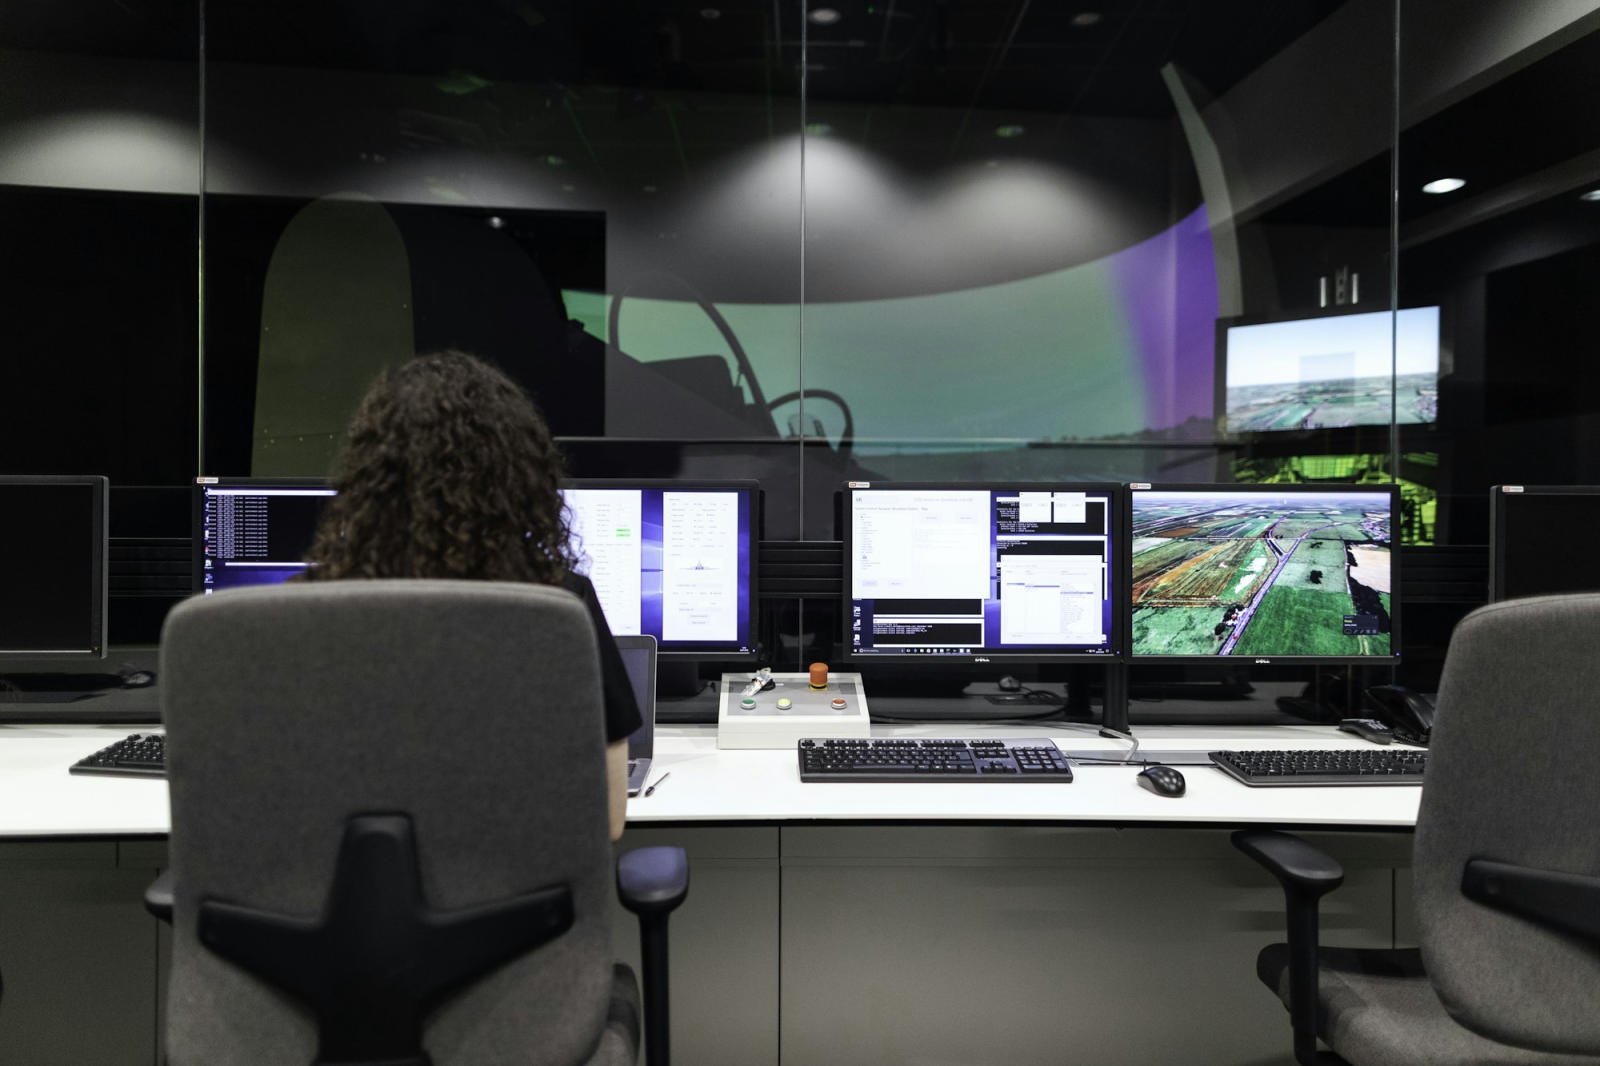
Operator monitoring screens● Deviation flagged · Cooling fan
  • Multi-site: pick the active location from a map or a list
  • Dashboard filtered by today, 7 days, 30 days or a year
  • Custom widgets: KPI tiles, charts, condition cards, alert feeds
  • Organizational chart with skills, departments and contractors
  • Runs in the browser on desktop, tablet and phone
  • Export of tickets, assets, parts, budgets and alarms
Book a demo

See it on your
own equipment.

Tell us what you run and where. We prepare the demo around your assets and sites.